Or how to deploy a complete monitoring architecture in few minutes.
Monitor.
In few years, monitoring has become an indispensable activity in the IT world. Technical or functional, whether it provides metrics, charts, or other KPIs, monitoring its system has become a must-have.
In the rest of the article, we will learn how to deploy a monitoring architecture from scratch, in few minutes, thanks to Docker.
The stack.
First off, we will use the ELK stack, which has become in a few years a credible alternative to other monitoring solutions (Splunk, SAAS …).
It is based on the following software:
- E as Elasticsearch, search engine which provide full text search & analytics,
- L as Logstash, an ETL for retrieving data from heterogeneous sources, transforming them and sending them to Elasticsearch,
- K as Kibana, which provide an UI for exploring data, and create interactive dashboards
But also :
- R as *Redis, *an upstream broker which will serve as buffer in case of latency of the system, while avoiding excessive congestion in case of a peak,
- C as Curator, a tool to manage our index
- B as Beats, client-side agent to send the logs/metrics to our stack
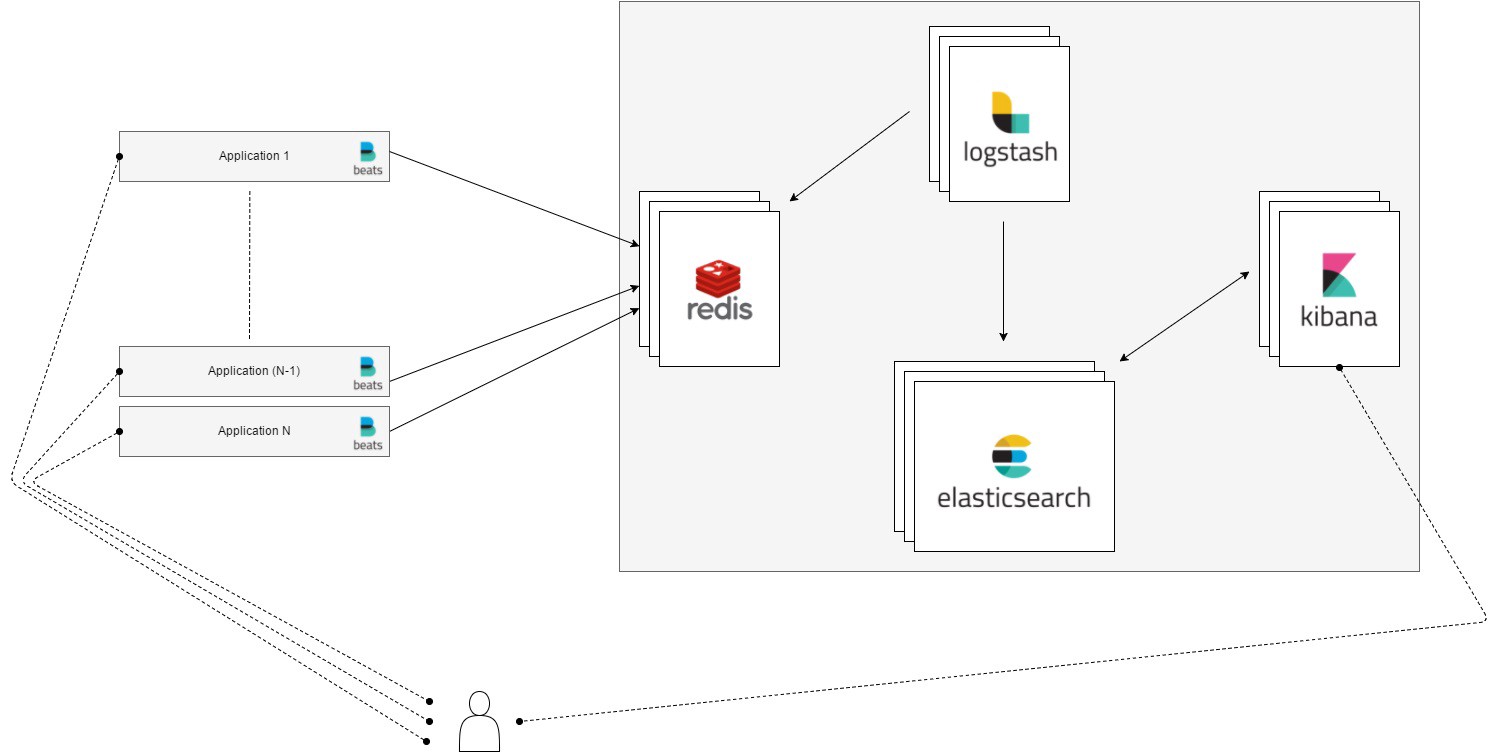 The complete architecture
Deploy.
We will use Docker containers for each stack component.
- Elasticsearch (5.1.2),
- Logstash (5.1.2),
- Kibana (5.1.2),
- Redis (3.2.6),
- Curator (4.0.4)
Services and interactions are described in a docker-compose.yml file:
| version: "2" | |
| services: | |
| # brocker | |
| redis: | |
| image: redis:3.2.6 | |
| container_name: redis | |
| ports: | |
| - 6379:6379 | |
| volumes: | |
| - redis-data:/data | |
| networks: | |
| - logging | |
| # index, search & agregation | |
| elasticsearch: | |
| image: elasticsearch:5.1.2 | |
| container_name: elastic | |
| environment: | |
| - ES_JAVA_OPTS=-Xms1g -Xmx1g | |
| ports: | |
| - 9200:9200 | |
| - 9300:9300 | |
| volumes: | |
| - $PWD/elasticsearch/config/elasticsearch.yml:/usr/share/elasticsearch/config/elasticsearch.yml | |
| - "es-data:/usr/share/elasticsearch/data" | |
| networks: | |
| - logging | |
| # UI | |
| kibana: | |
| image: kibana:5.1.2 | |
| container_name: kibana | |
| ports: | |
| - 5601:5601 | |
| volumes: | |
| - $PWD/kibana/config/kibana.yml:/etc/kibana/kibana.yml | |
| networks: | |
| - logging | |
| depends_on: | |
| - elasticsearch | |
| # indexer | |
| logstash: | |
| image: logstash:5.1.2 | |
| container_name: logstash | |
| command: logstash -f /config/ | |
| environment: | |
| - JAVA_OPTS=-Xms1g -Xmx1g | |
| volumes: | |
| - $PWD/logstash/config:/config | |
| networks: | |
| - logging | |
| depends_on: | |
| - elasticsearch | |
| - redis | |
| volumes: | |
| es-data: | |
| driver: local | |
| redis-data: | |
| driver: local | |
| networks: | |
| logging: | |
| driver: bridge |
A viable configuration is also available on my github account : dockerelkstack.
Hello, world.
Based on this repository, we will deploy a functional stack:
# clone repo & build images
git clone [https://github.com/d3rwan/docker_elk_stack](https://github.com/d3rwan/docker_elk_stack)
cd docker_elk_stack
docker-compose build

# run (daemon)
docker-compose up -d

# show logs
docker-compose logs
After startup, you should be able to access Kibana (port 5601).
Then, we will deploy a basic example web app (NGinx serving HTML + Filebeat agent to send log in our stack)
# build image
docker build ./webapp -t dockerelkstack_webapp

# run (daemon)
docker run --network dockerelkstack_logging --link redis:redis -p 80:80 -d --name webapp dockerelkstack_webapp

# show logs
docker logs webapp
After startup, you should be able to access the web app (port 80).
)](/d3rwan-blog/media/elk/joliadmin.png) Example web app capture (source: https://github.com/sbilly/joli-admin)
Example web app capture (source: https://github.com/sbilly/joli-admin)
After few minutes browsing, returning to Kibana. An index logstash-* is now available.
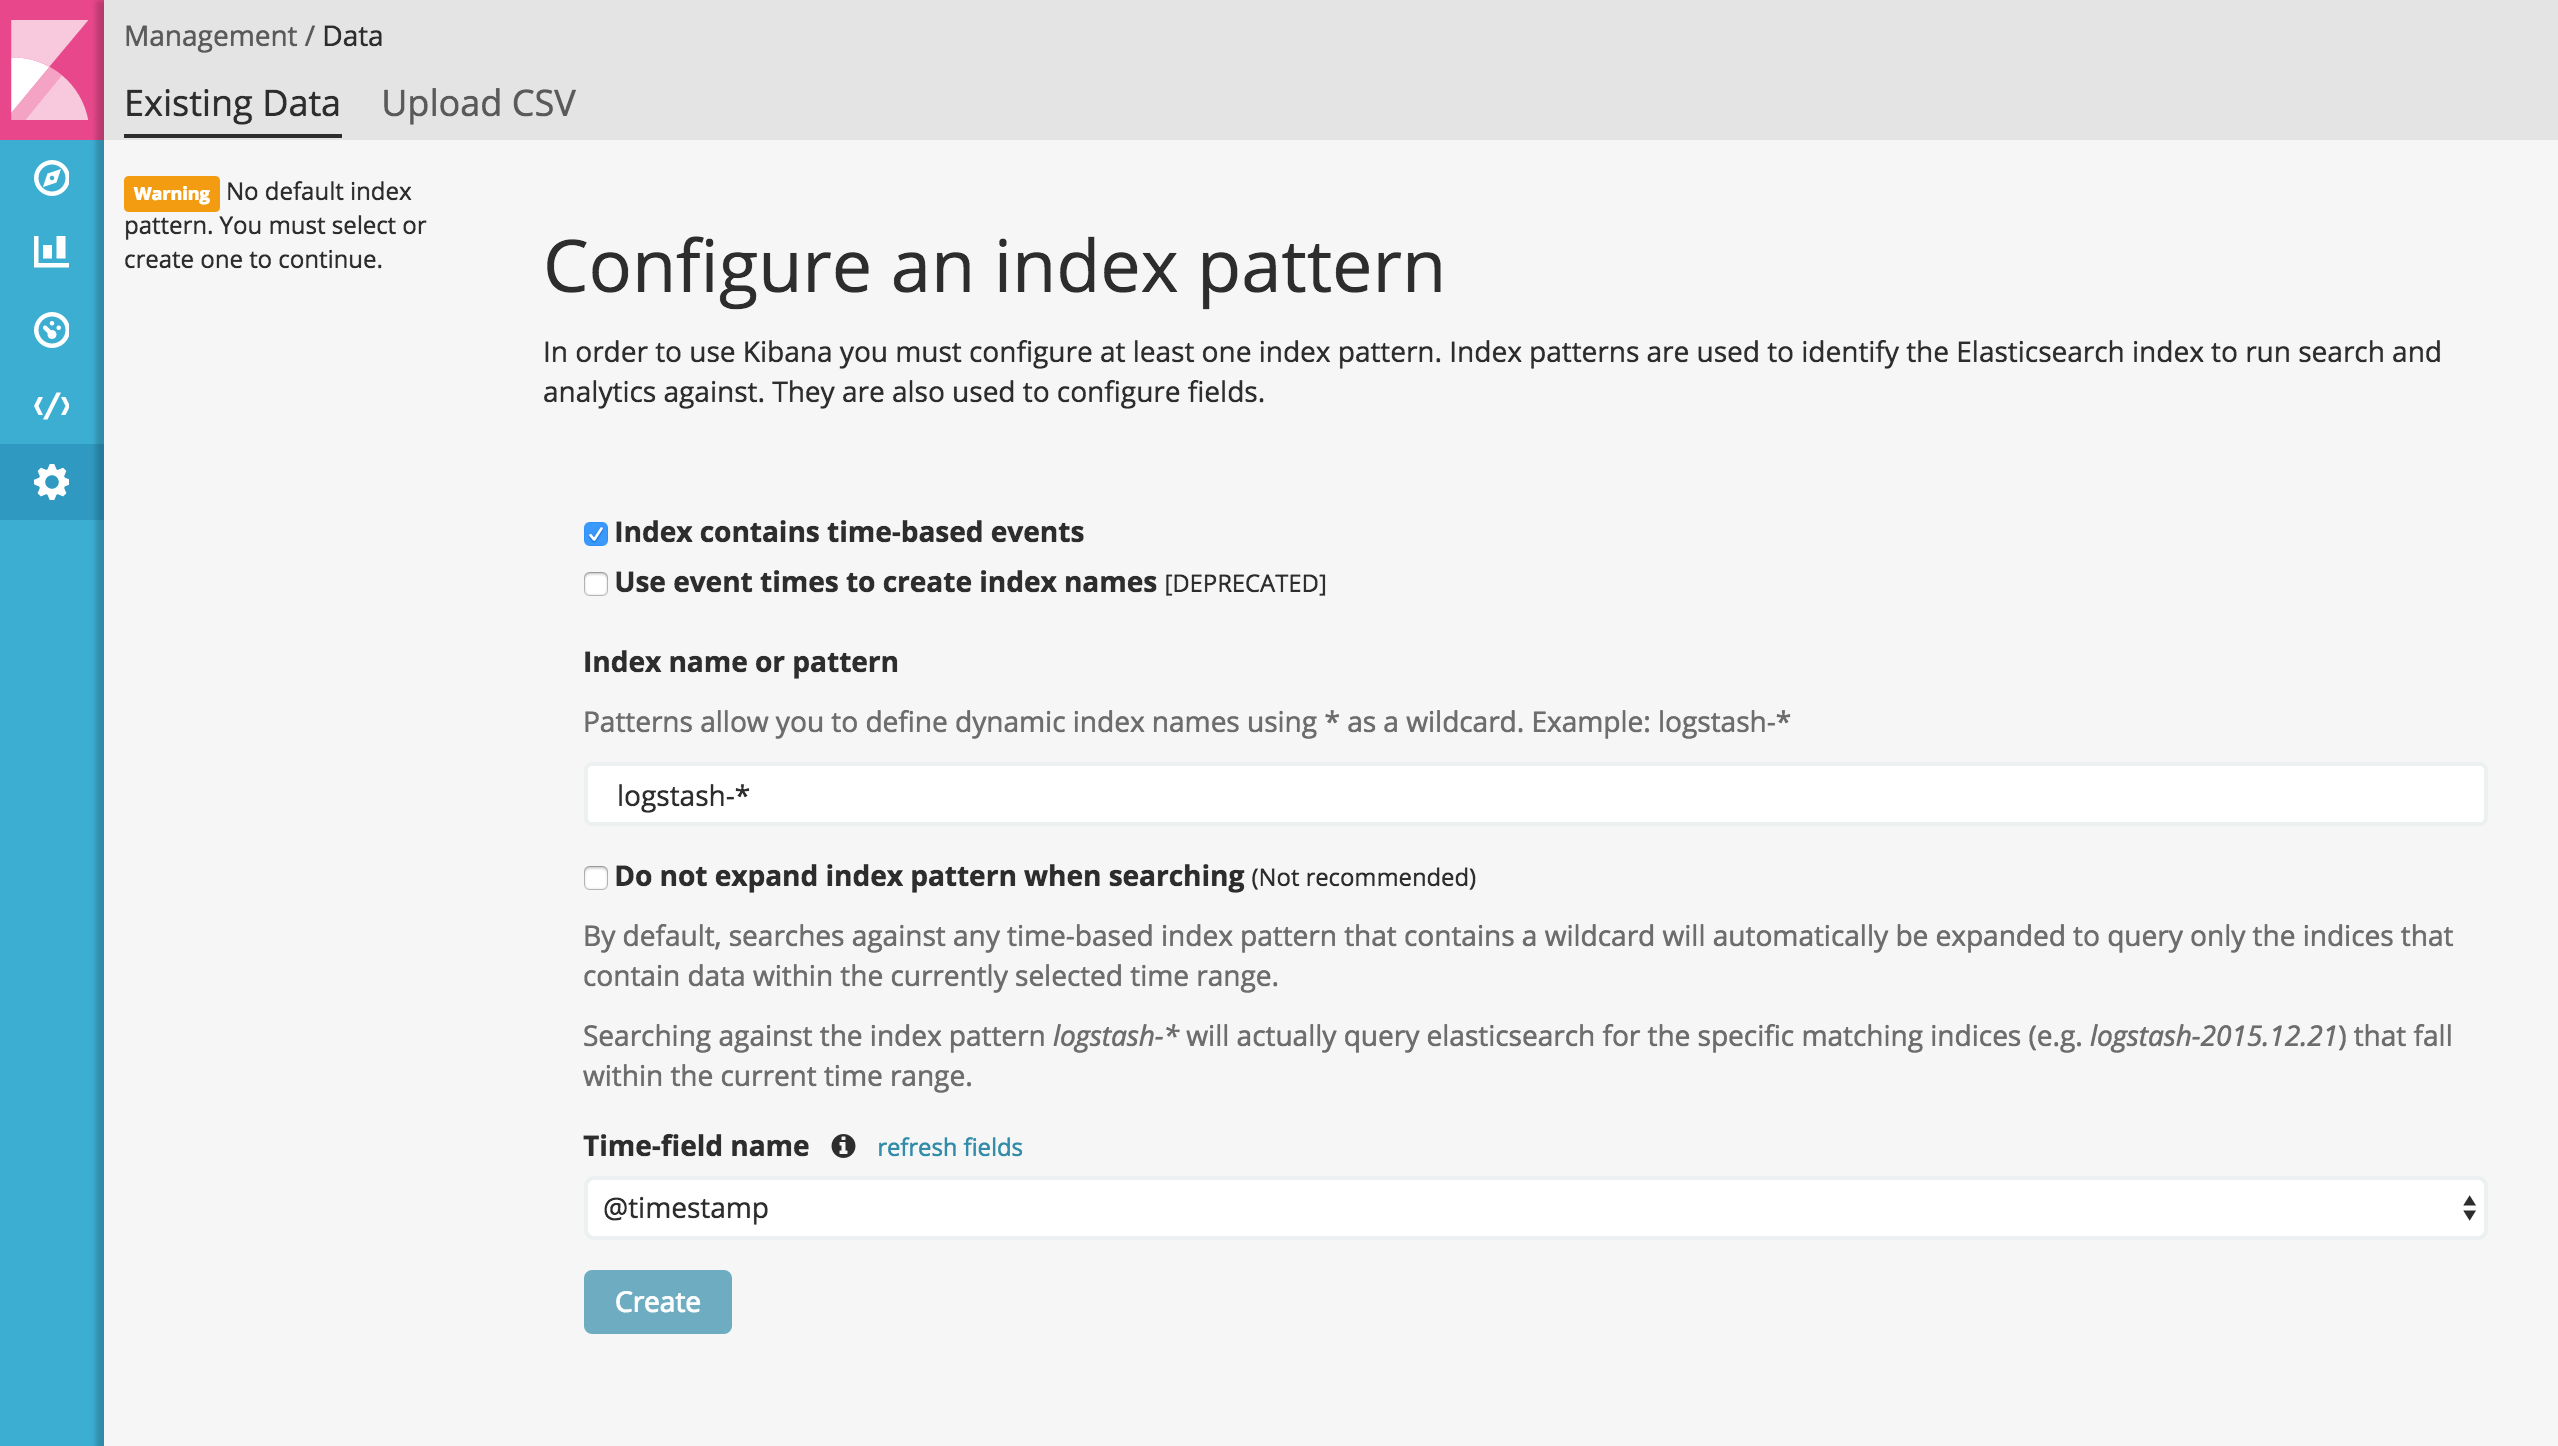 Kibana: Index pattern configuration screen (here, logstash-* index is available)
After creating index, we can now exploring our web app logs (Discover tab), create visualizations (Visualize tab) and dashboards (Dashboard tab).
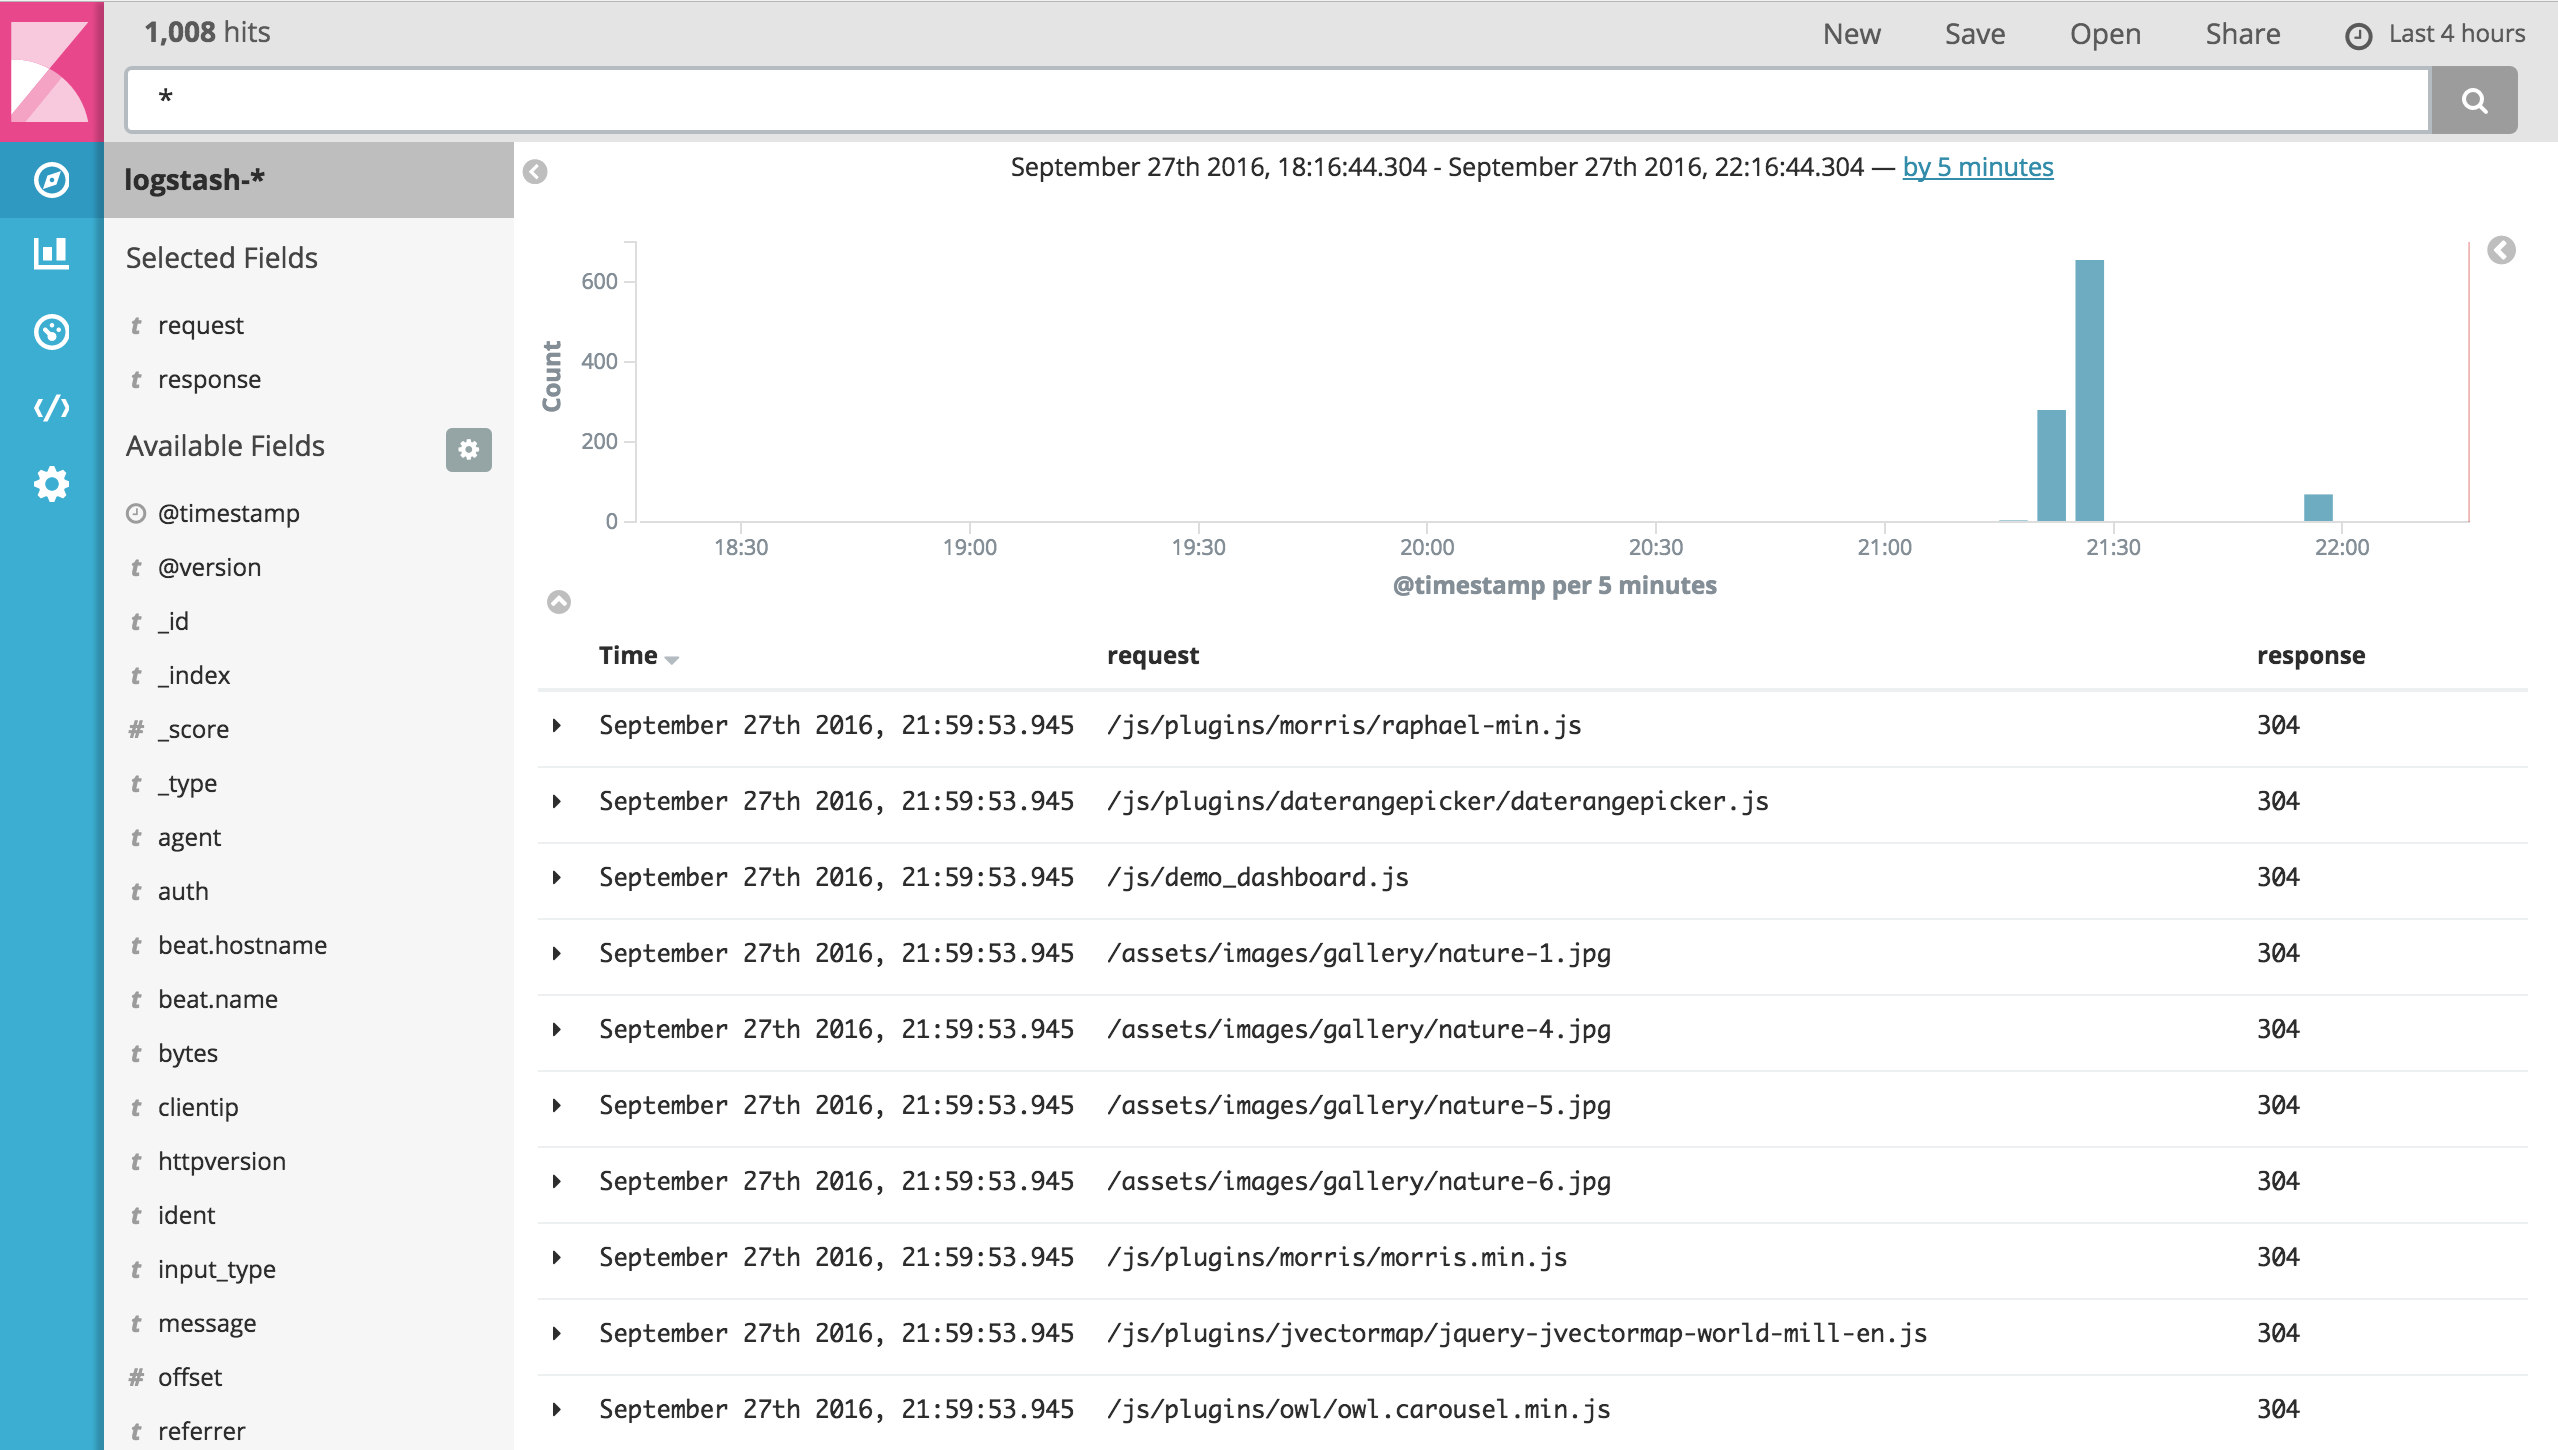 Kibana: Exploring the raw logs
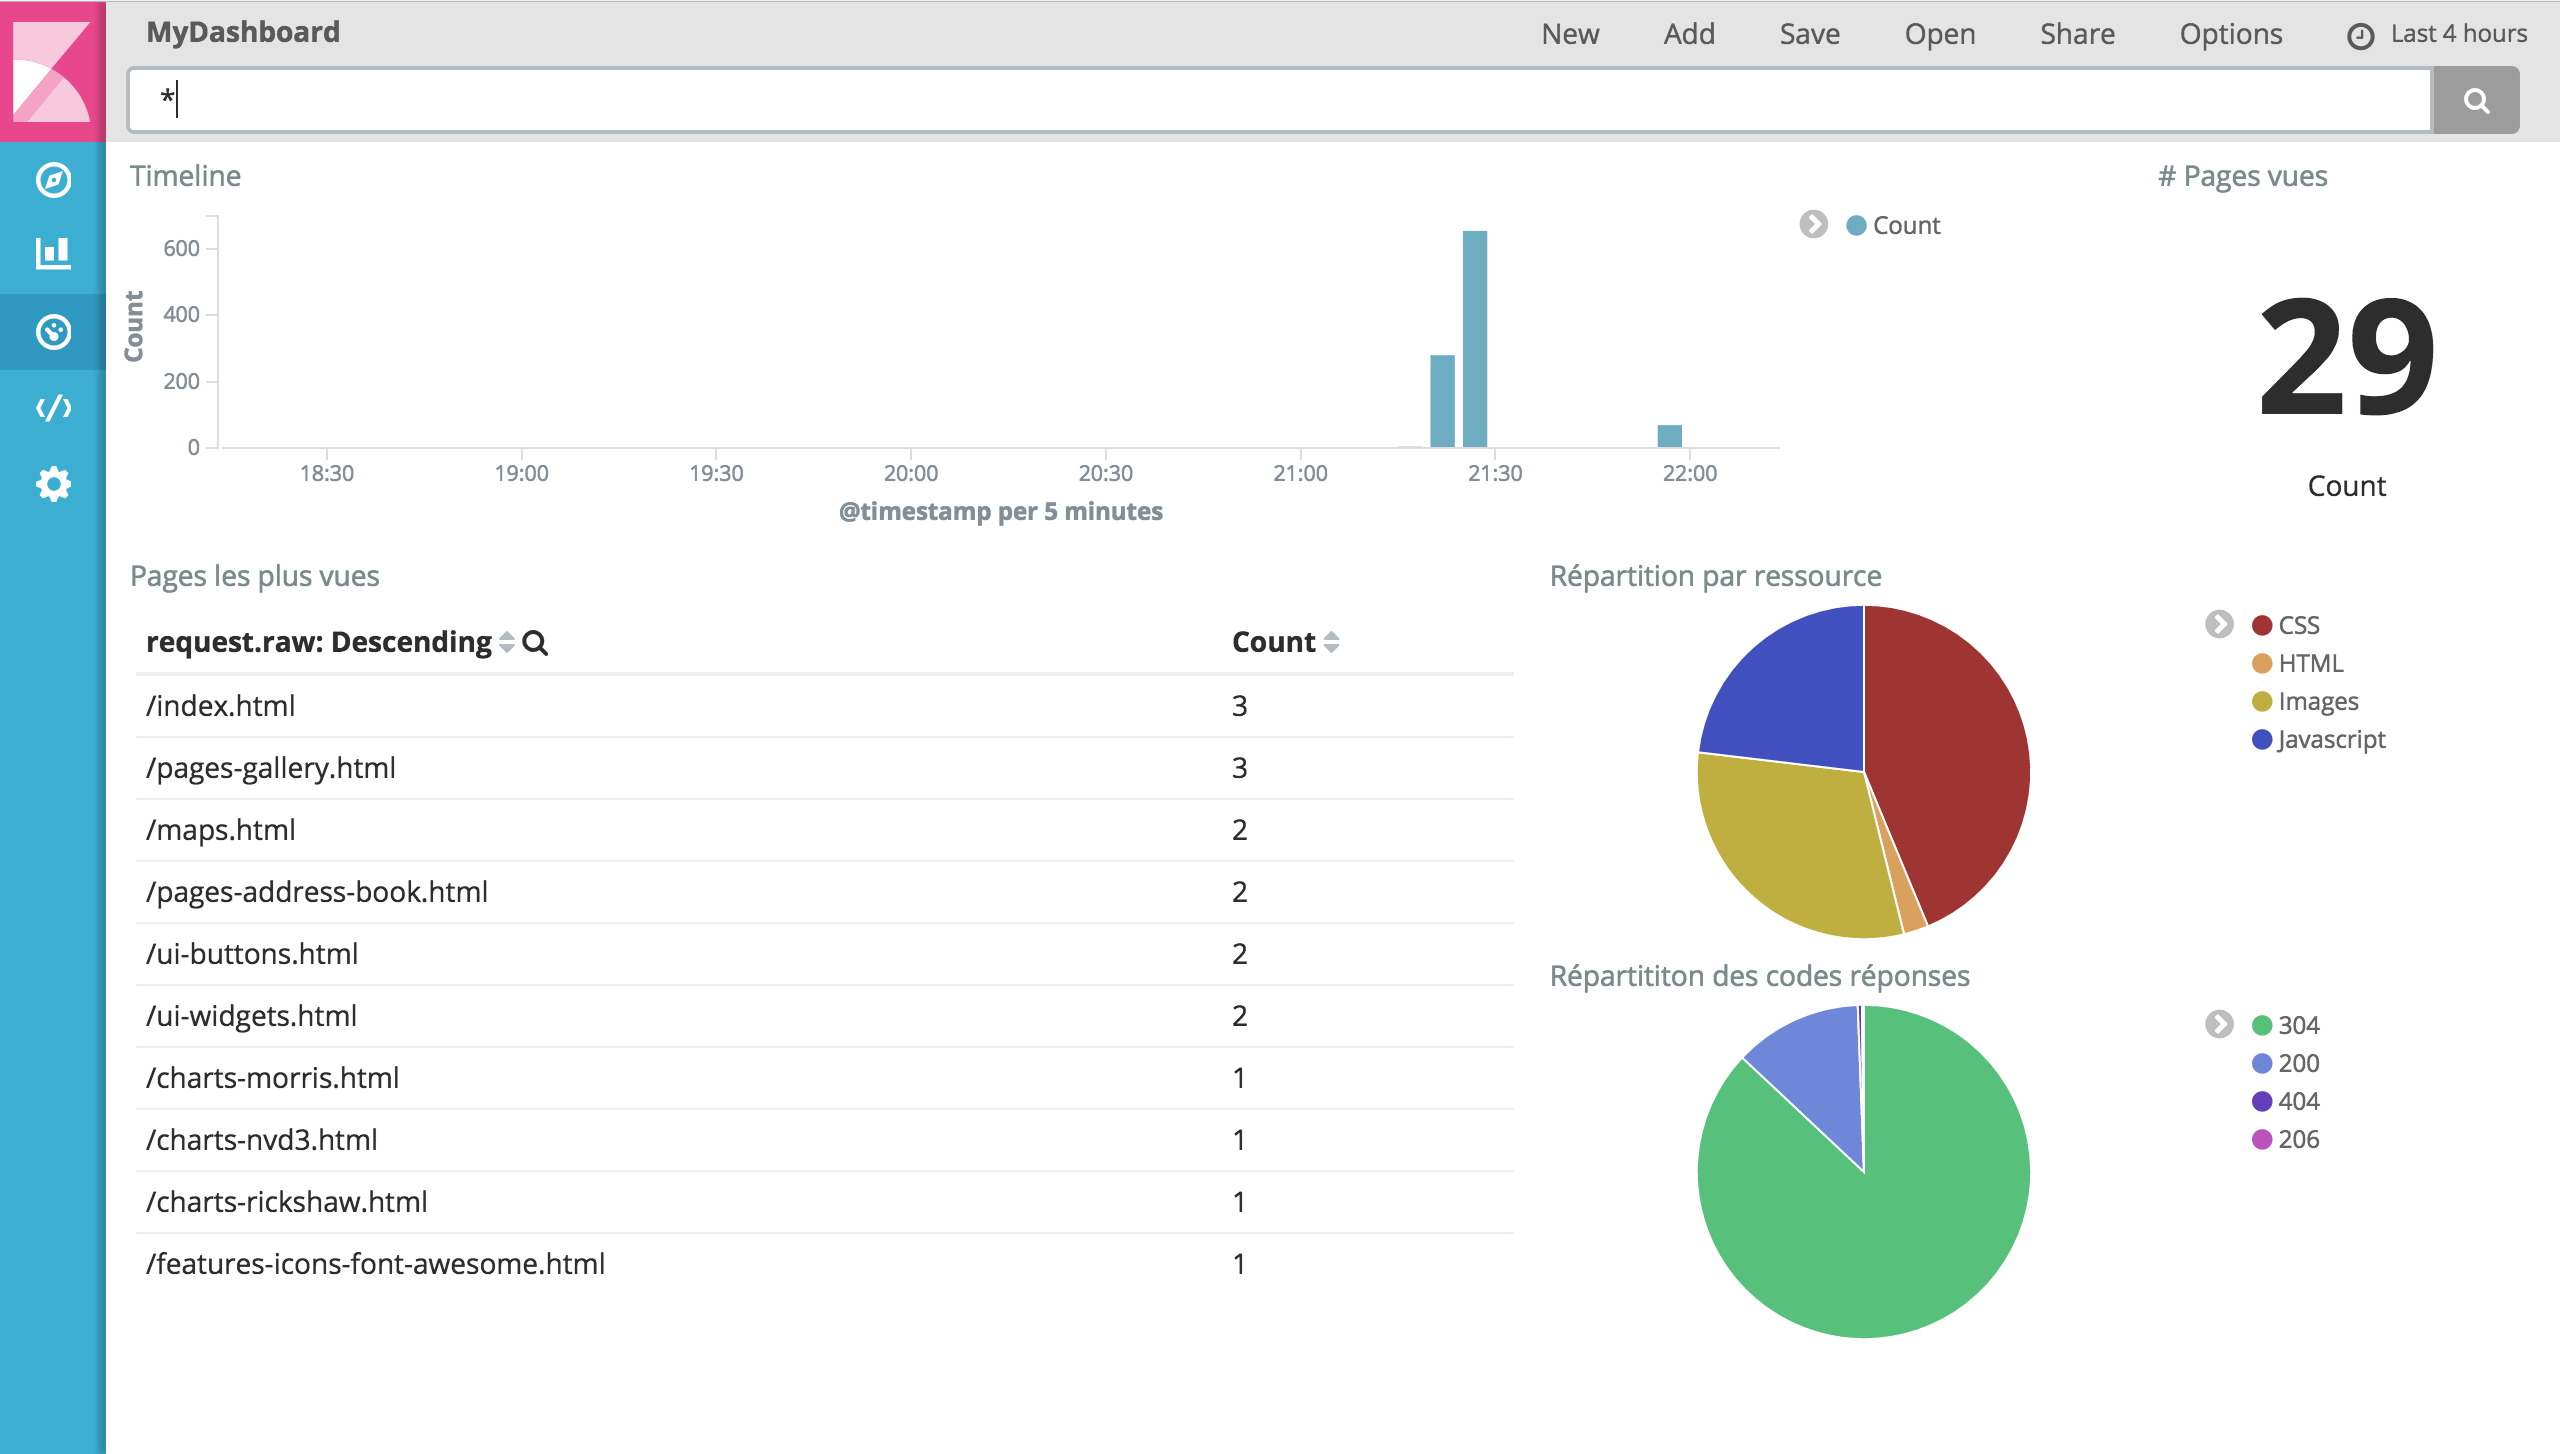 Kibana: Analytic dashboard
And… voilà! In just few minutes, we set up, an operational monitoring stack.