TL/DR
Logstash + Rust = Vector ?
We can actually describe Vector as a Logstash built in Rust, with all the language’s advantages for free (high performance, cross-compilation), but the flaws of a still young product (few modules, no known references). Note that the documentation seems well done, and the first existing modules allow you to manage a lot of simple monitoring use-case. As we can agree that Logstash is not the best product in the world, let’s hope that Vector will find its place in the community in the coming months. In addition, Vector natively offers modules equivalent to the Logstash’s one, which means that the migration will not be complicated!
And so what ? We have time, right ? #LockedDown
Vector could be defined as an high-performance observability data router that makes transforming, collecting, and sending events (logs & metrics) easy.
Concept
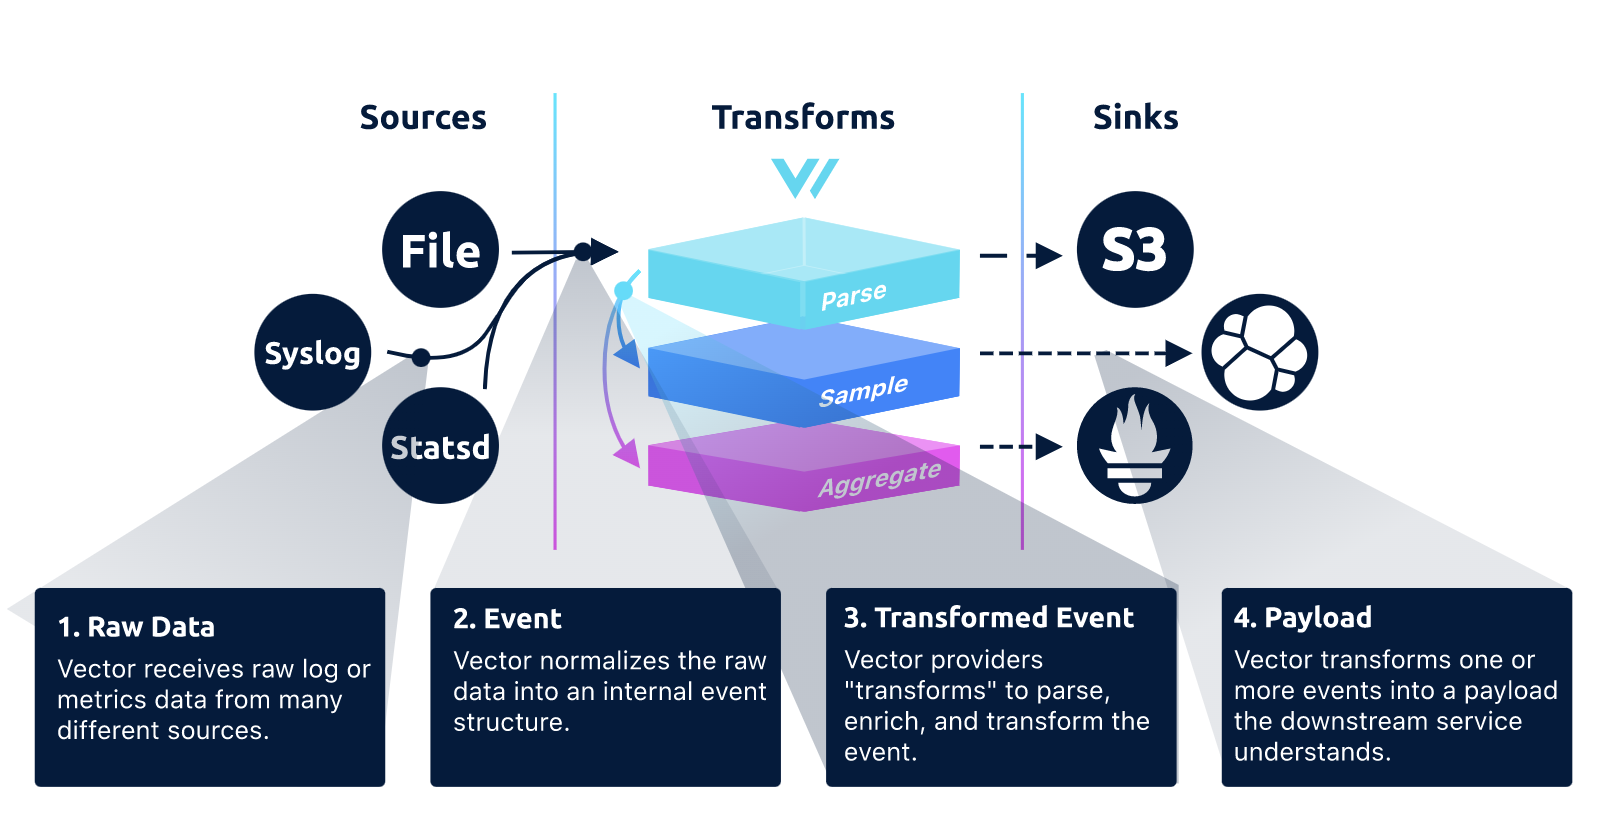
Basically, it’s an ETL based on the following concepts:
- Source (aka. E / Extract)
Reading raw data from the source. For example, we could read log into a file, listen a Kafka topic or get StatsD metrics
- Transform (aka. T / Transform)
Transform raw data, or complete data stream. For example, we could filter entries or parse a log using a regular expression
- Sink (aka. L / Load)
Destination for events. Each module’s transmission method is dictated by the downstream service it is interacting with (ie. individual events, bulk or stream). For example, we could save raw data into Amazon S3, indexing them into Elasticsearch or expose to Prometheus
Features
Fast
Built in Rust, Vector is fast and memory-efficient, all without runtime or garbage collector
One only tool, from source to destination
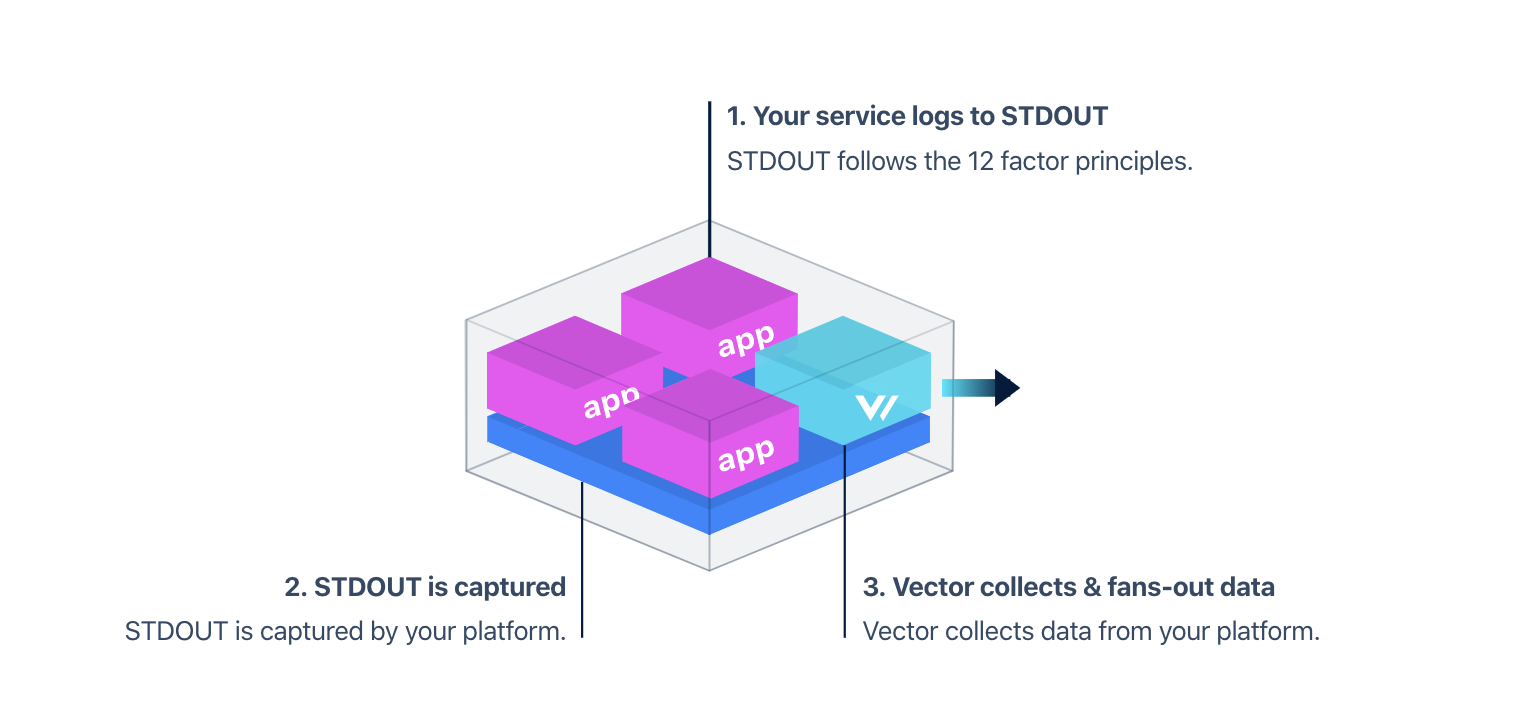
Vector is designed to be used by everyone, whatever the context, by offering several deployment strategies:
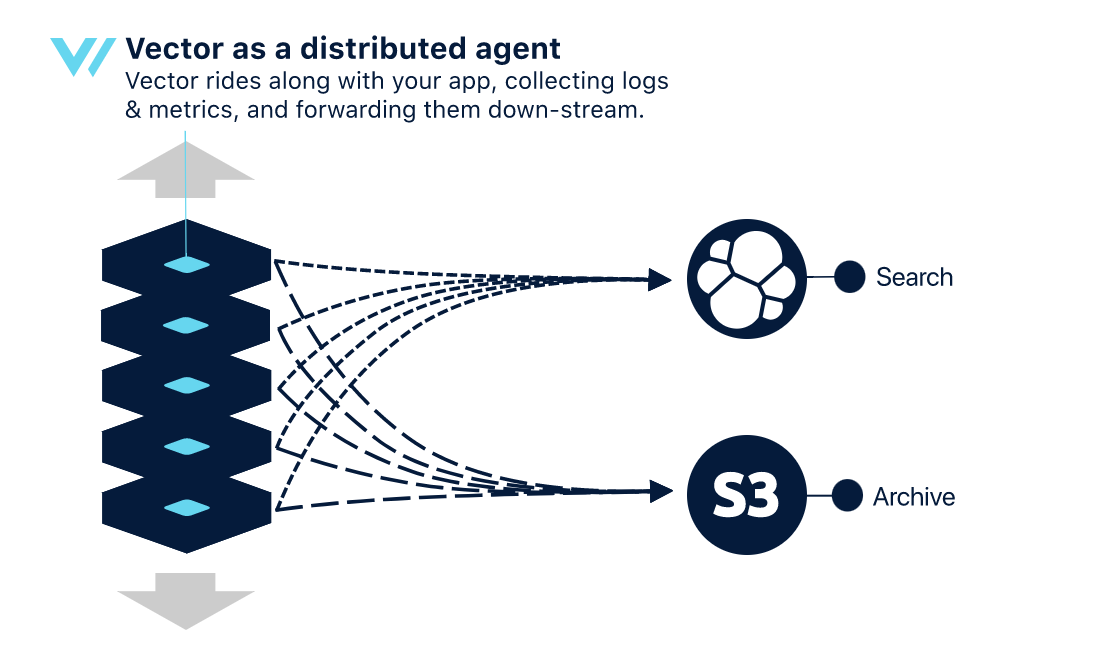
In this case, it serves as serves as an light-weight agent by running in the background, in its own process, for collecting all data for that host.
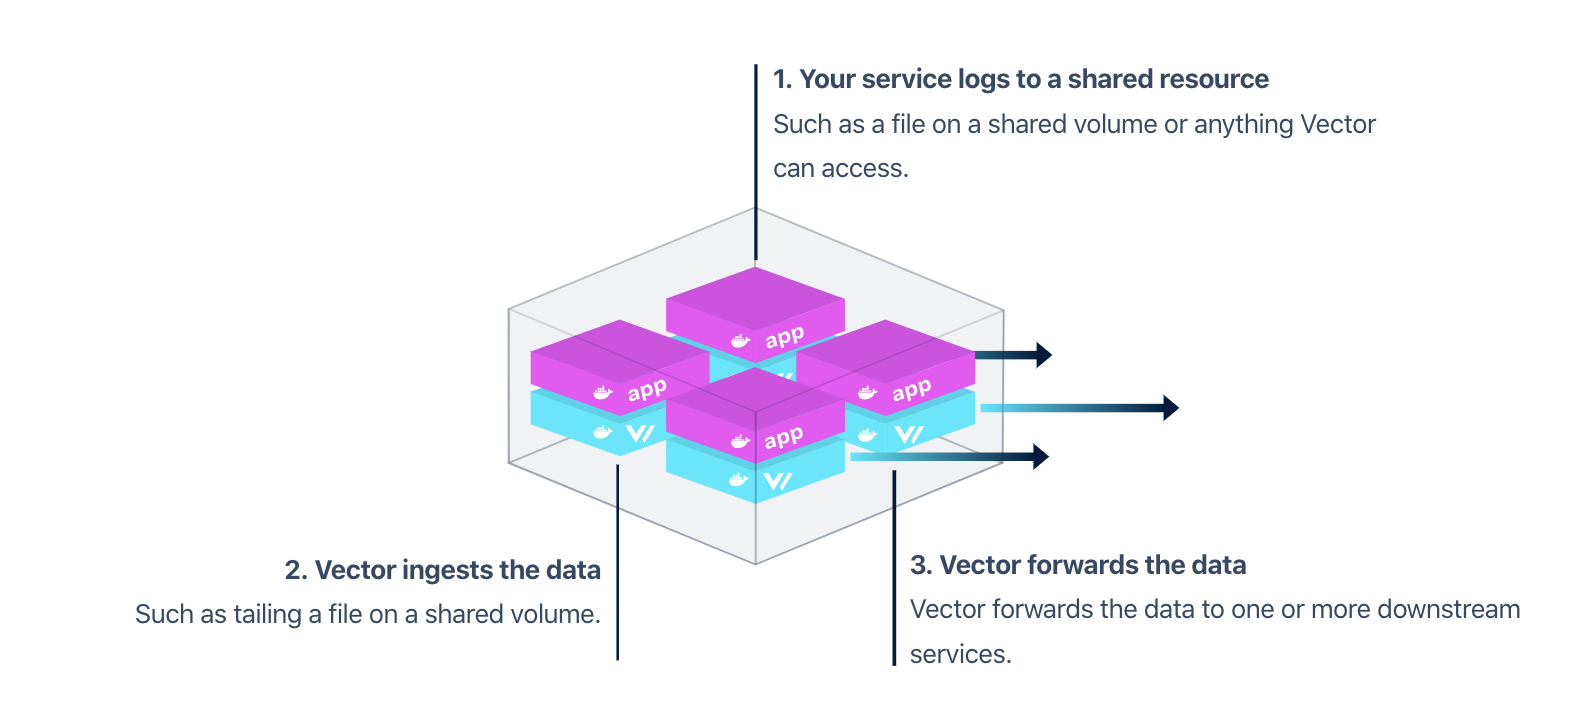
Here, it serves also an an agent, but we will have one process by service.
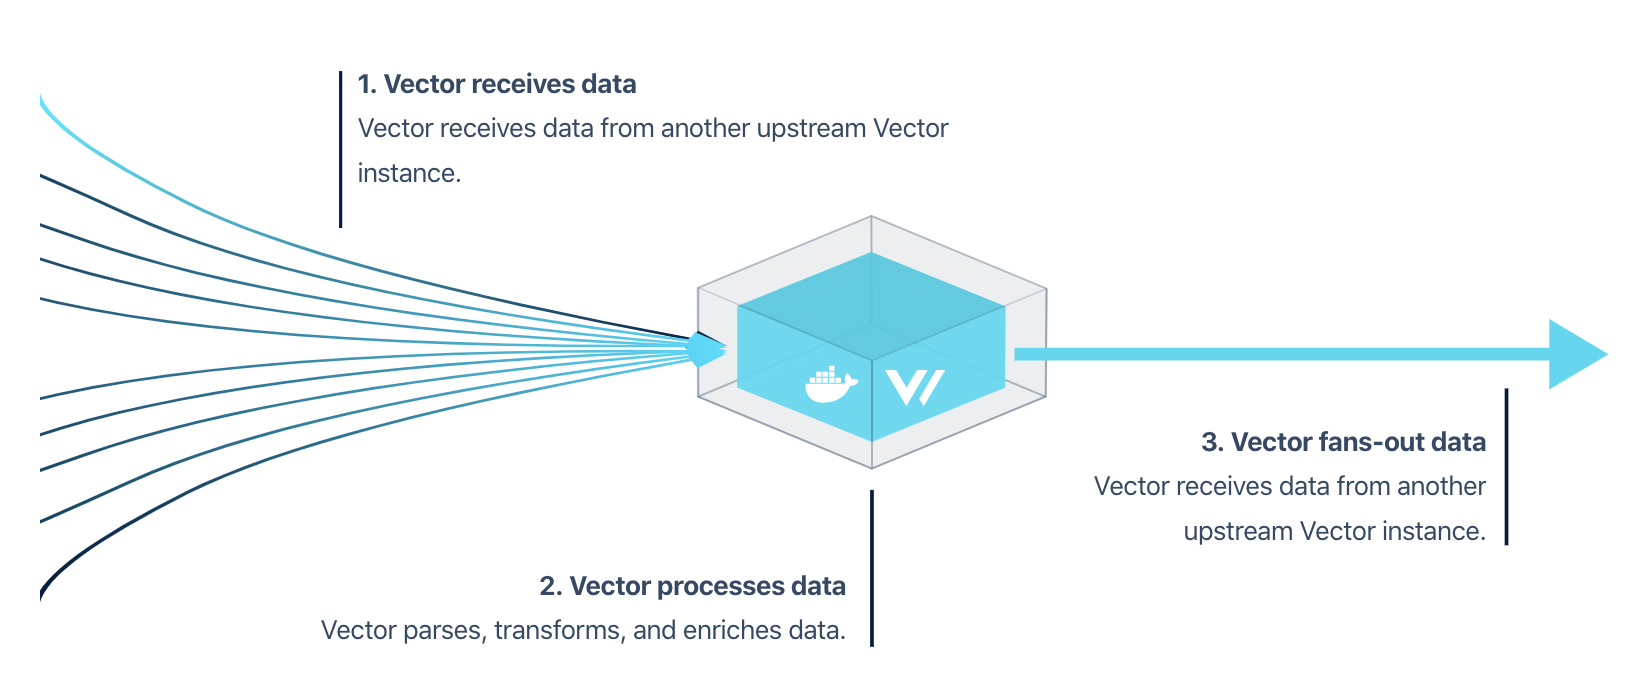
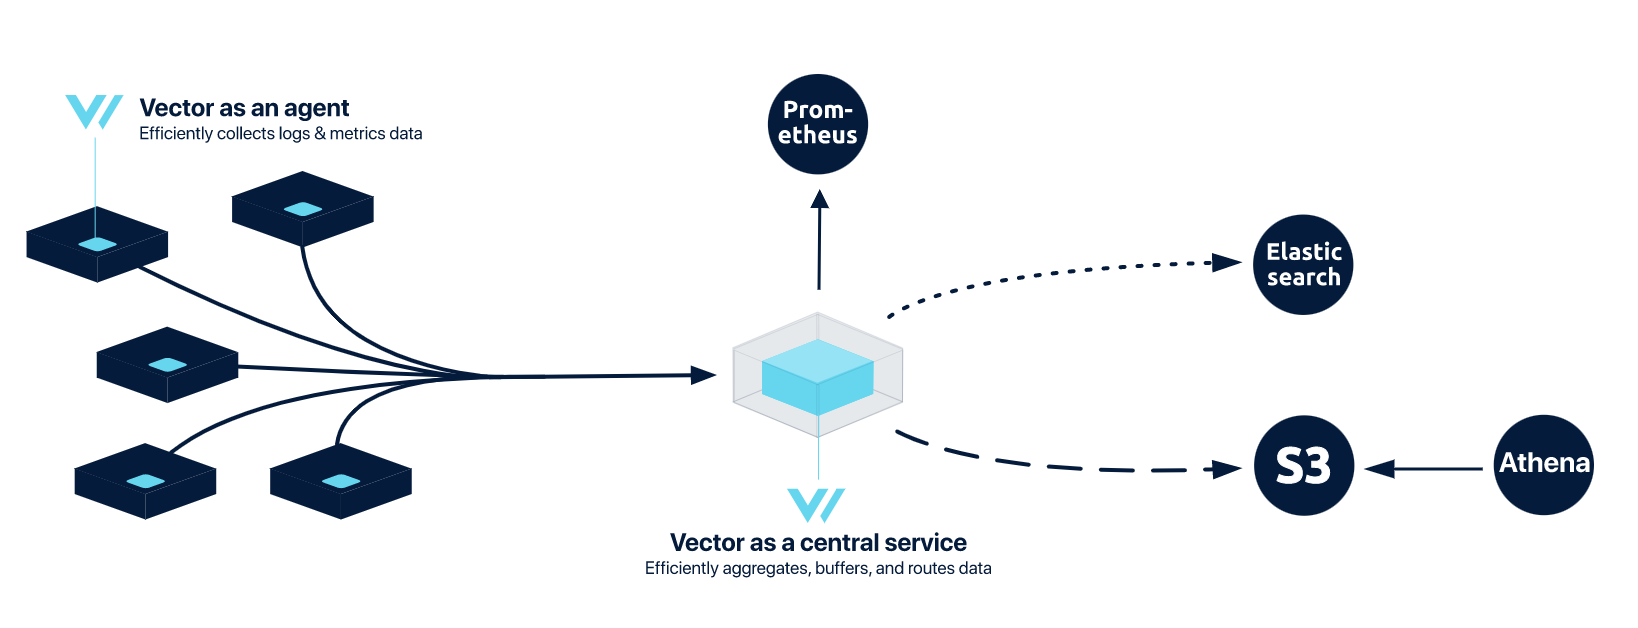
In ths case, Vector is a separate service designed to receive data from an upstream source and fan-out to one or more destinations.
By using and/or combining theses strategies, we can define several architecture topologies to collect our data.
In this topology, each Vector instance will directly send data to downstream services. It’s the simplest topology, and it will easily scale with our architecture. However, it can impact local performance or lead to data losses.
Here, each agent will send data to a dedicated centralized Vector instance, which will responsible to do the most expensive operations. So, it’s more efficient for client nodes, but a dedicated centralized service as a SPOF which could lead to data losses.
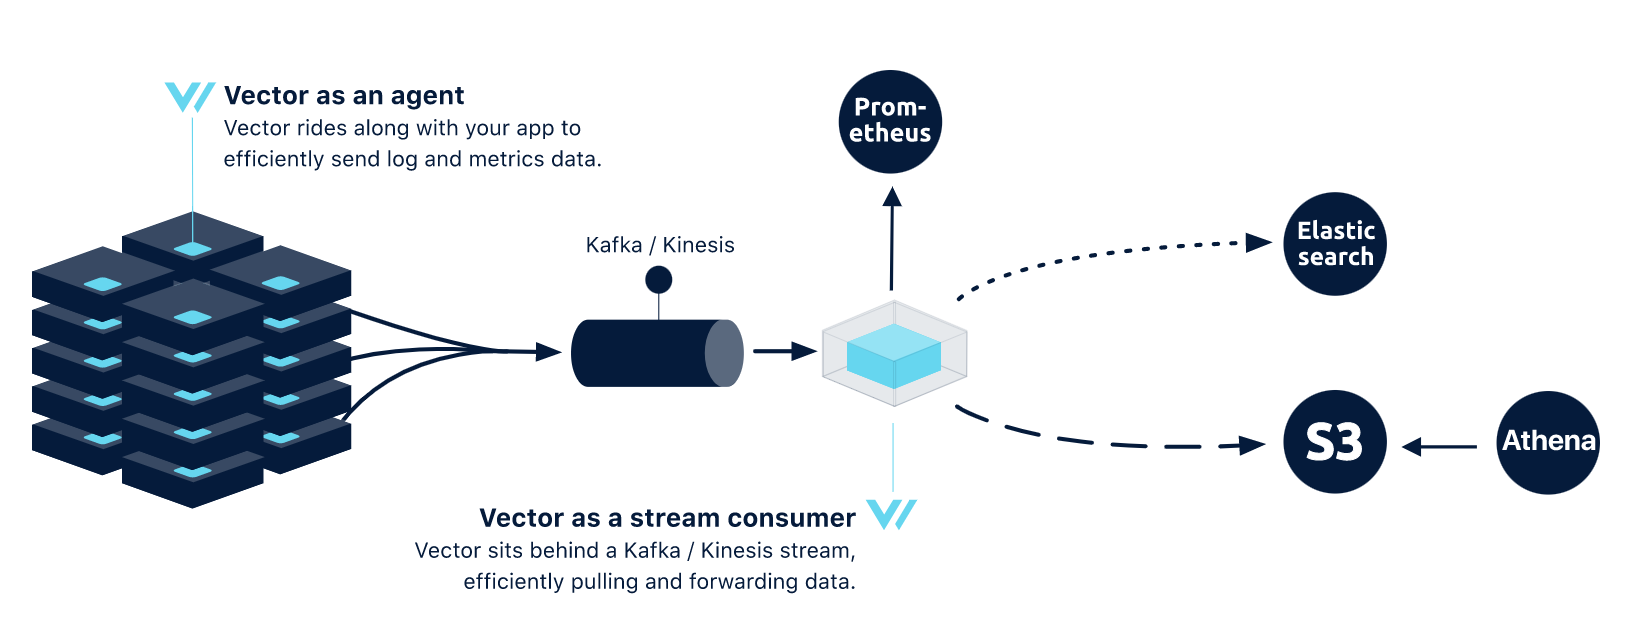
Variant of the previous topology, in which we will add a broker upstream of the centralized service in order to remove the SPOF. This topology is the most scalable and reliable, but also the most complex and expensive.
Easy deployment
Built with Rust, Vector cross-compiles to a single static binary without any runtime.
Well, but does it really works ?
I will be inspired by a previous blog post : An ELK stack from scratch, with Docker
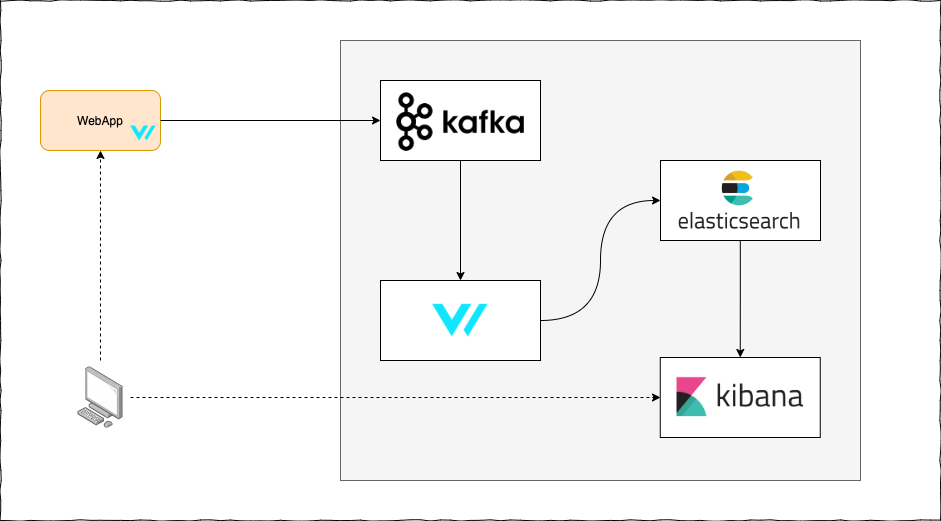 Proof of concept architecture
In this case, we will use:
- Elasticsearch, search engine which provide full text search & analytics,
- Kibana, which provide an UI for exploring data, and create interactive dashboards
- Vector, as central service, to transform events and sending them to Elasticsearch,
- Kafka, as an upstream broker
- Vector, as an agent, to ingest raw source data and sending them to Kafka
So here, we are under a Stream based topology
Services and interactions are described in a docker-compose.yml file:
| version: "3.7" | |
| services: | |
| zookeeper: | |
| image: confluentinc/cp-zookeeper:5.4.0 | |
| hostname: zookeeper | |
| container_name: zookeeper | |
| ports: | |
| - "2181:2181" | |
| environment: | |
| ZOOKEEPER_CLIENT_PORT: 2181 | |
| ZOOKEEPER_TICK_TIME: 2000 | |
| kafka: | |
| image: confluentinc/cp-enterprise-kafka:5.4.0 | |
| hostname: kafka | |
| container_name: kafka | |
| depends_on: | |
| - zookeeper | |
| ports: | |
| - "29092:29092" | |
| - "9092:9092" | |
| environment: | |
| KAFKA_BROKER_ID: 1 | |
| KAFKA_ZOOKEEPER_CONNECT: 'zookeeper:2181' | |
| KAFKA_LISTENER_SECURITY_PROTOCOL_MAP: PLAINTEXT:PLAINTEXT,PLAINTEXT_HOST:PLAINTEXT | |
| KAFKA_ADVERTISED_LISTENERS: PLAINTEXT://kafka:29092,PLAINTEXT_HOST://localhost:9092 | |
| KAFKA_OFFSETS_TOPIC_REPLICATION_FACTOR: 1 | |
| KAFKA_GROUP_INITIAL_REBALANCE_DELAY_MS: 0 | |
| elasticsearch: | |
| image: docker.elastic.co/elasticsearch/elasticsearch:7.6.2 | |
| container_name: elastic | |
| environment: | |
| - ES_JAVA_OPTS=-Xms1g -Xmx1g | |
| - discovery.type=single-node | |
| - network.host=_site_, _local_ | |
| ulimits: | |
| memlock: | |
| soft: -1 | |
| hard: -1 | |
| ports: | |
| - 9200:9200 | |
| - 9300:9300 | |
| vector: | |
| image: timberio/vector:0.8.0-alpine | |
| container_name: vector | |
| ports: | |
| - 8888:8888 | |
| volumes: | |
| - $PWD/vector.toml:/etc/vector/vector.toml:ro | |
| depends_on: | |
| - kafka | |
| - elasticsearch | |
| kibana: | |
| image: docker.elastic.co/kibana/kibana:7.6.2 | |
| container_name: kibana | |
| ports: | |
| - 5601:5601 | |
| depends_on: | |
| - elasticsearch | |
| webapp: | |
| build: ./webapp/ | |
| container_name: webapp | |
| ports: | |
| - 80:80 | |
| - 9999:9999 |
The Vector central service is configured as below:
- Reading events from Kafka
- JSON Parsing from events send by Vector agent
- Grok Parsing (same as Logstash Grok format) from raw log line
- Indexing into Elasticsearch
| # Set global options | |
| data_dir = "/var/lib/vector" | |
| [sources.from_broker] | |
| type = "kafka" | |
| bootstrap_servers = "kafka:29092" | |
| group_id = "vector-consumer" | |
| topics = ["events"] | |
| [transforms.json_parser] | |
| type = "json_parser" | |
| inputs = ["from_broker"] | |
| drop_field = true | |
| field = "message" | |
| [transforms.log_parser] | |
| type = "grok_parser" | |
| inputs = ["json_parser"] | |
| pattern = '%{IPORHOST:client} - %{USERNAME:user} \[%{HTTPDATE:timestamp}\] \"%{WORD:verb} %{NOTSPACE:path} HTTP/%{NUMBER}\" %{INT:status} %{NUMBER:bytes} \"%{DATA:referer}\" \"%{DATA:user_agent}\"' | |
| types.status = "int" | |
| types.bytes = "int" | |
| types.timestamp = "timestamp|%d/%b/%Y:%H:%M:%S %z" | |
| [sinks.to_indexer] | |
| type = "elasticsearch" | |
| inputs = ["log_parser"] | |
| healthcheck = false | |
| host = "http://elasticsearch:9200" | |
| [[tests]] | |
| name = "test_log_parser" | |
| [[tests.inputs]] | |
| insert_at = "json_parser" | |
| type = "raw" | |
| value = '172.21.0.1 - - [28/Feb/2020:12:38:46 +0000] "GET /path/to/a HTTP/1.1" 200 46459 "http://localhost/path/to/b" "Mozilla/5.0 (Macintosh; Intel Mac OS X 10_15_3) AppleWebKit/537.36 (KHTML, like Gecko) Chrome/80.0.3987.122 Safari/537.36" "-"' | |
| [[tests.outputs]] | |
| extract_from = "log_parser" | |
| [[tests.outputs.conditions]] | |
| type = "check_fields" | |
| "client.equals" = "172.21.0.1" | |
| "user.equals" = "-" | |
| "timestamp.equals"= "2020-02-28T12:38:46Z" | |
| "verb.equals" = "GET" | |
| "path.equals" = "/path/to/a" | |
| "status.equals" = 200 | |
| "bytes.equals" = 46459 | |
| "referer.equals" = "http://localhost/path/to/b" | |
| "user_agent.equals" = "Mozilla/5.0 (Macintosh; Intel Mac OS X 10_15_3) AppleWebKit/537.36 (KHTML, like Gecko) Chrome/80.0.3987.122 Safari/537.36" |
Fun fact, we can unit testing our configuration, as we can see in the [[tests]] section.
Note that each configuration step is based on at least one previous step.
On our webapp side, we will have an Vector agent configured as below:
- Reading logs from file
- Sending them to Kafka
| # Set global options | |
| data_dir = "/var/lib/vector" | |
| [sources.from_file] | |
| type = "file" | |
| include = ["/var/log/nginx/*.log"] | |
| [sinks.to_broker] | |
| type = "kafka" | |
| inputs = ["from_file"] | |
| bootstrap_servers = "kafka:29092" | |
| topic = "events" | |
| encoding = "json" |
Complete projet is available on github discovering_vector
Now, I can start all my services with docker-compose:
 docker-compose build
 docker-compose up
Then, you should be able to access the web app (http://localhost:80, in my case)
 Web Application example (source: https://github.com/sbilly/joli-admin)
After few minutes browsing, you can go to Kibana UI. (in my case, http://localhost:5601), then click on Management tab, then Kibana > Index Patterns
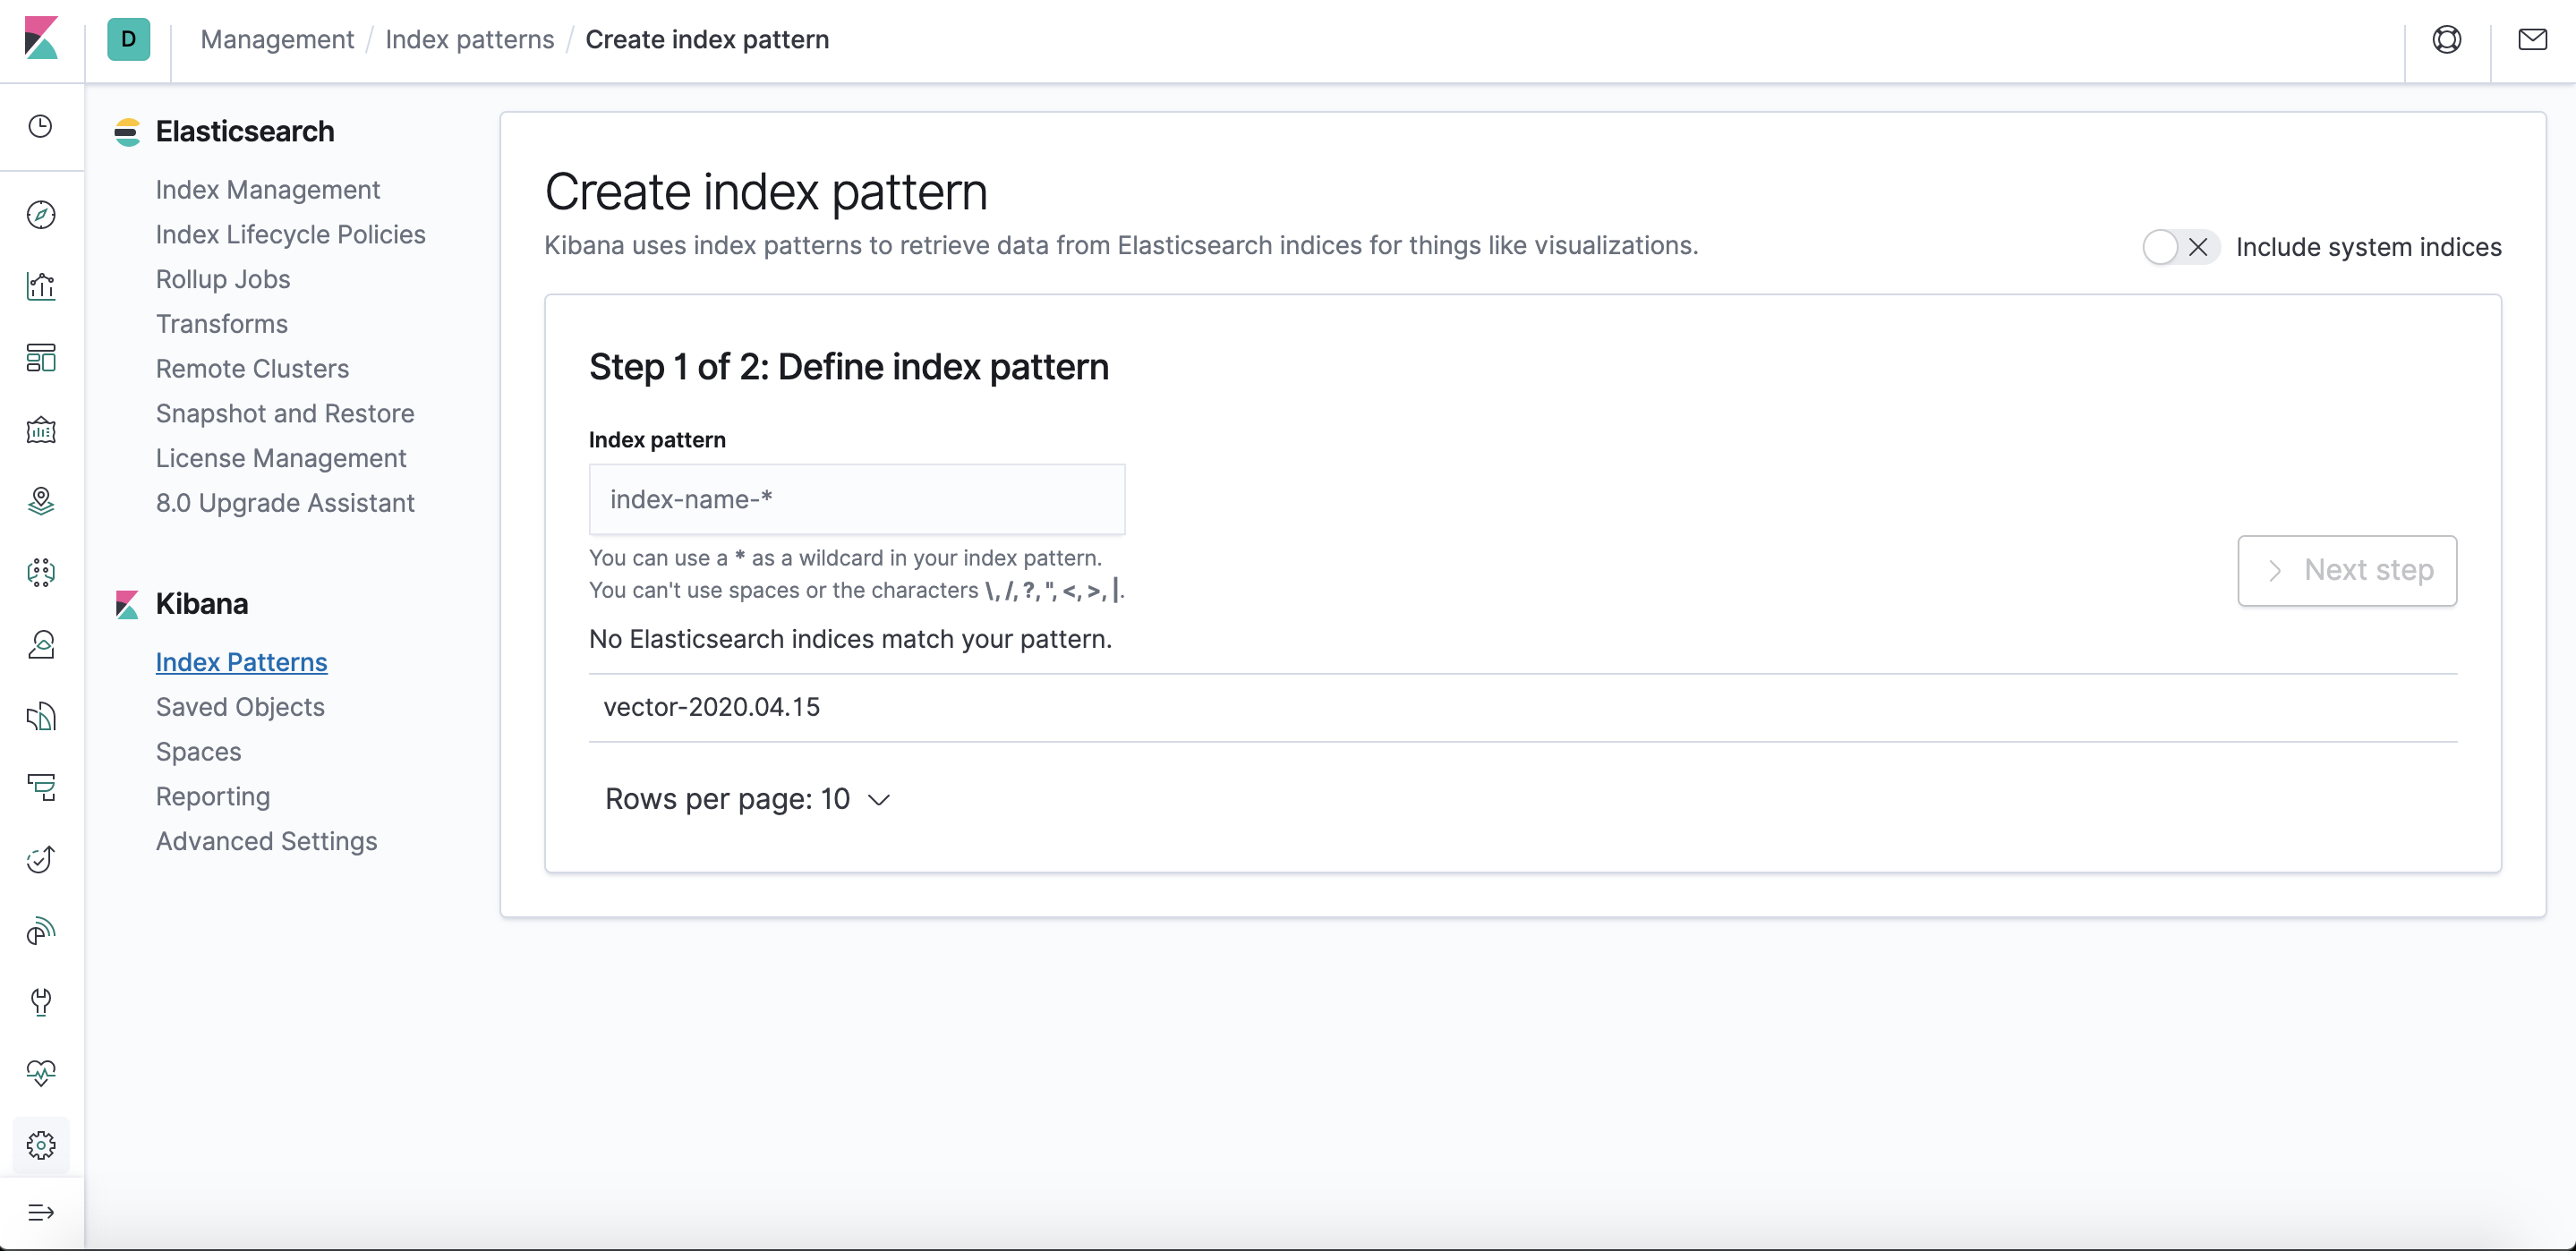 Adding vector-* index pattern
Here we go ! A vector-YYYY.MM.DD index should be created with my application logs.
From there, I will be able to create my searchs, visualizations, dashboards or canvas in Kibana, and use all theses informations.
To conclude, it’s actually quite easy to use Vector as a substitute for Logstash/Beats in an Elastic stack, and it works. Remains to see if performance gains are real, and if the project can resist in the future and become a real alternative for the community. Until then, even very young, this project is full of promises and good ideas (unit tests, multi-topologies, …), and so deserves that we take a look!